
Microsoft Excel

Fit for management: with our Excel tutorials
Get your data into shape for Microsoft Excel : Our Excel tutorials will strengthen your know-how right where you are at the moment. Are you still unfamiliar with formulas and functions? Are you already an old administrator? Either way, our video tutorial s will help you work more efficiently and keep track of even large data sets. From the basics to special tricks - count on a comprehensive wealth of knowledge. Our reference card with all the important shortcuts for Excel promises to make things even easier. Fill up on office power now - get fit for administration!
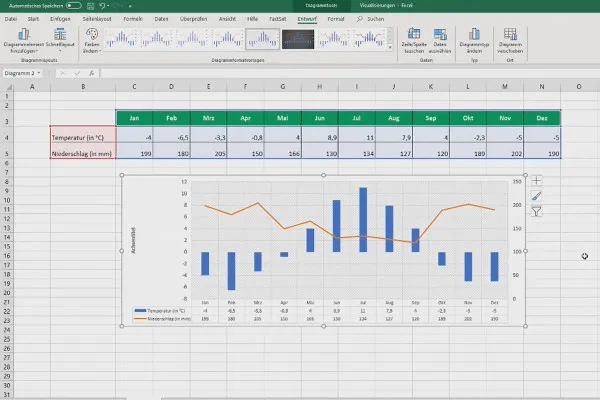
Create Excel charts and visualize data - the complete course

Create Excel charts and visualize data - the complete course
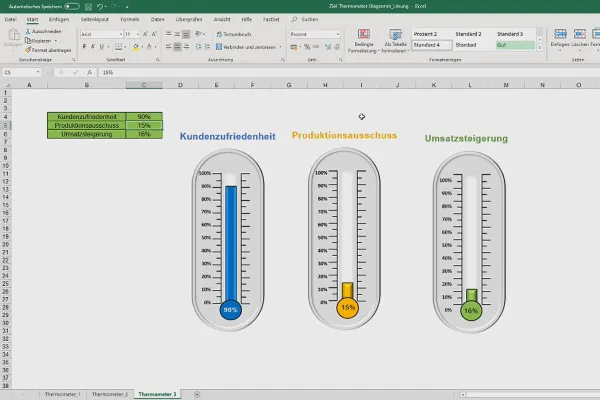
Create Excel charts and visualize data - the complete course

Create Excel charts and visualize data - the complete course
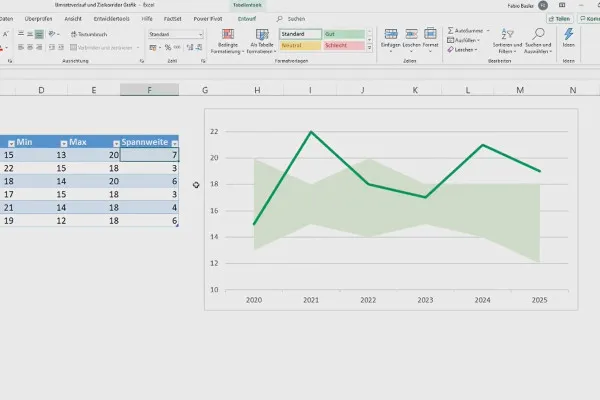
Create Excel charts and visualize data - the complete course

Create Excel charts and visualize data - the complete course
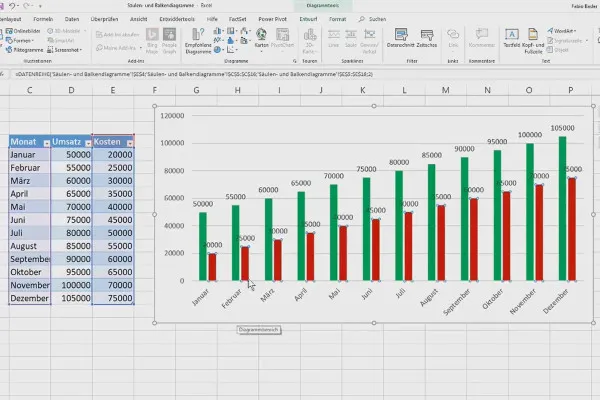
Create Excel charts and visualize data - the complete course

Create Excel charts and visualize data - the complete course
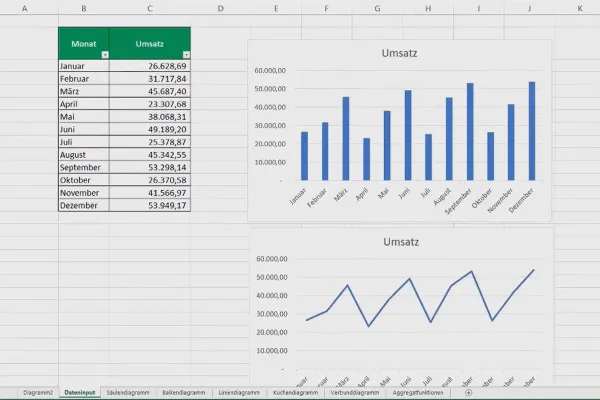
Create Excel charts and visualize data - the complete course

Create Excel charts and visualize data - the complete course
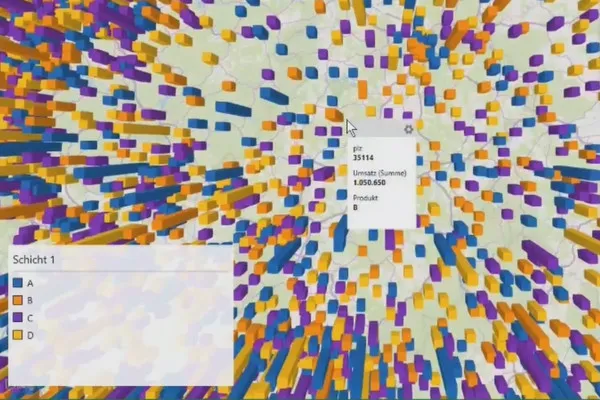
Create Excel charts and visualize data - the complete course

Create Excel charts and visualize data - the complete course

Creating and formatting pivot tables in Excel: from analysis to dashboards
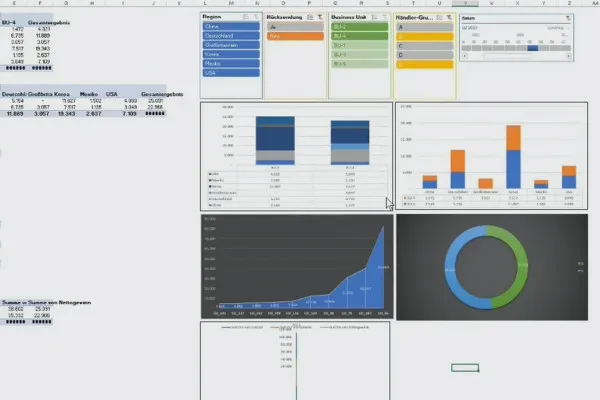
Creating and formatting pivot tables in Excel: from analysis to dashboards

Creating and formatting pivot tables in Excel: from analysis to dashboards
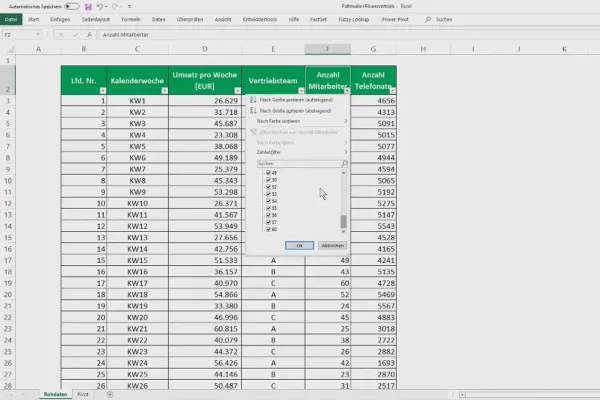
Creating and formatting pivot tables in Excel: from analysis to dashboards

Creating and formatting pivot tables in Excel: from analysis to dashboards
Creating and formatting pivot tables in Excel: from analysis to dashboards

Creating and formatting pivot tables in Excel: from analysis to dashboards
Creating and formatting pivot tables in Excel: from analysis to dashboards

Creating and formatting pivot tables in Excel: from analysis to dashboards
Creating and formatting pivot tables in Excel: from analysis to dashboards

Creating and formatting pivot tables in Excel: from analysis to dashboards
Creating and formatting pivot tables in Excel: from analysis to dashboards

Creating and formatting pivot tables in Excel: from analysis to dashboards
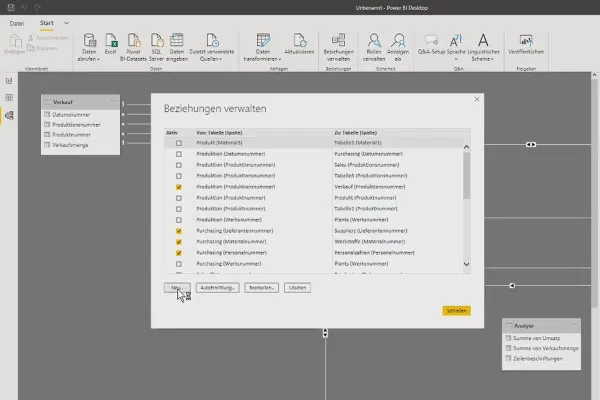
Creating and formatting pivot tables in Excel: from analysis to dashboards

Creating and formatting pivot tables in Excel: from analysis to dashboards

Creating and formatting pivot tables in Excel: from analysis to dashboards

Creating and formatting pivot tables in Excel: from analysis to dashboards

Creating and formatting pivot tables in Excel: from analysis to dashboards

Creating and formatting pivot tables in Excel: from analysis to dashboards

Creating and formatting pivot tables in Excel: from analysis to dashboards
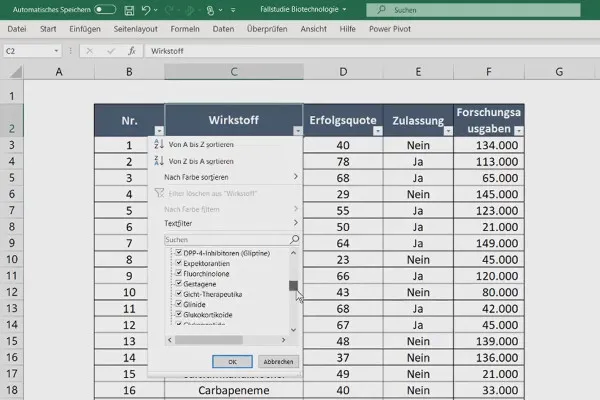
Statistics with Excel - learn and practice in practice

Statistics with Excel - learn and practice in practice

Statistics with Excel - learn and practice in practice

Statistics with Excel - learn and practice in practice

Statistics with Excel - learn and practice in practice

Statistics with Excel - learn and practice in practice
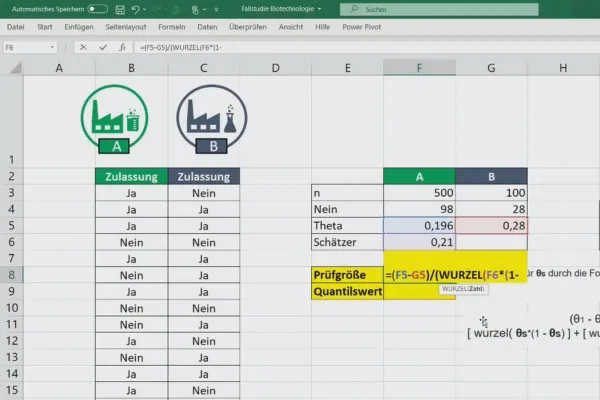
Statistics with Excel - learn and practice in practice

Statistics with Excel - learn and practice in practice
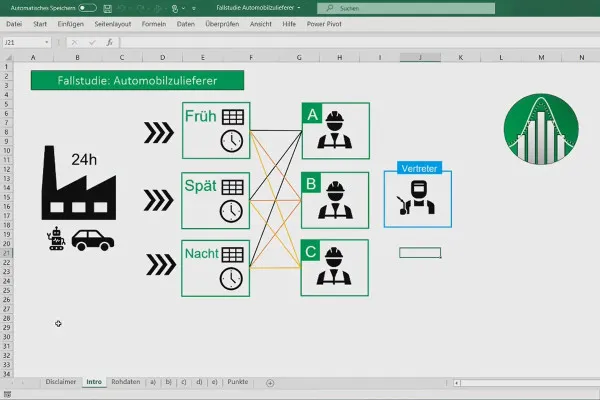
Statistics with Excel - learn and practice in practice

Statistics with Excel - learn and practice in practice
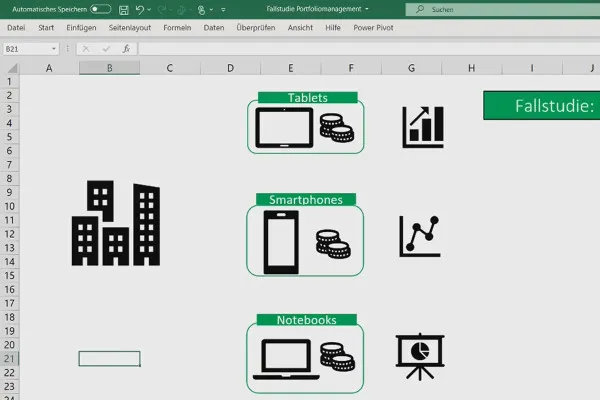
Statistics with Excel - learn and practice in practice

Statistics with Excel - learn and practice in practice
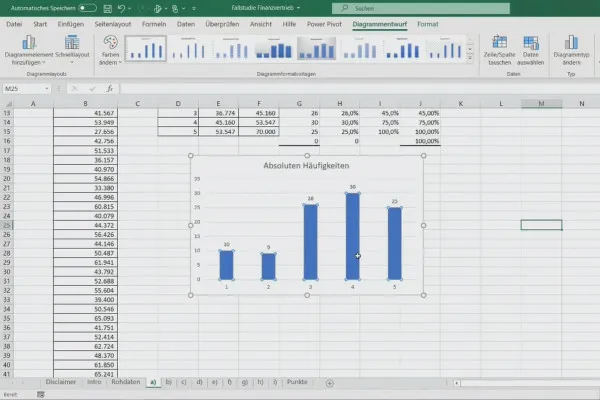
Data analysis with Excel for business and sales (video course)

Data analysis with Excel for business and sales (video course)
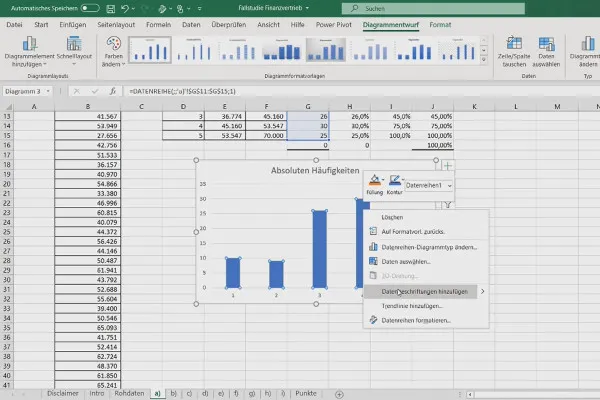
Data analysis with Excel for business and sales (video course)

Data analysis with Excel for business and sales (video course)
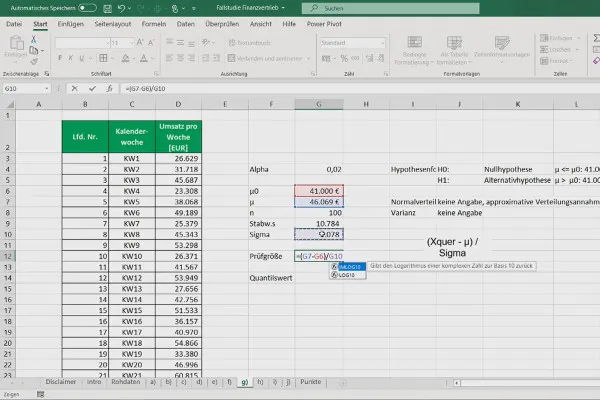
Data analysis with Excel for business and sales (video course)

Data analysis with Excel for business and sales (video course)

Excel: Evaluating questionnaires and surveys - statistics using a practical case study
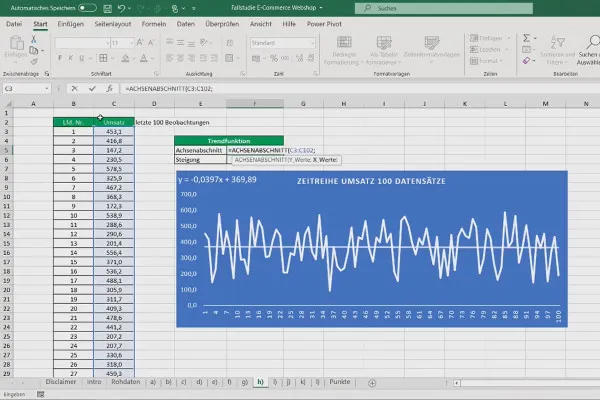
Excel: Evaluating questionnaires and surveys - statistics using a practical case study

Excel: Evaluating questionnaires and surveys - statistics using a practical case study
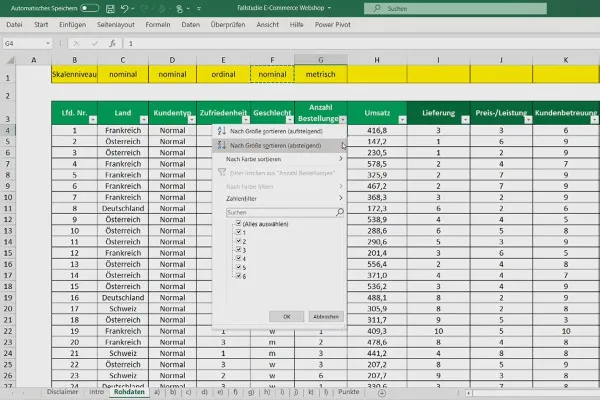
Excel: Evaluating questionnaires and surveys - statistics using a practical case study

Excel: Evaluating questionnaires and surveys - statistics using a practical case study
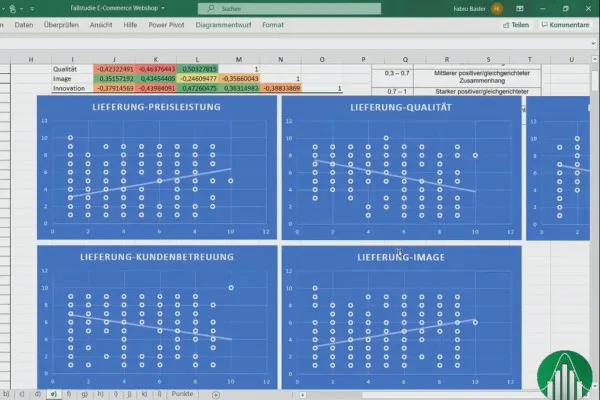
Excel: Evaluating questionnaires and surveys - statistics using a practical case study

Excel: Evaluating questionnaires and surveys - statistics using a practical case study
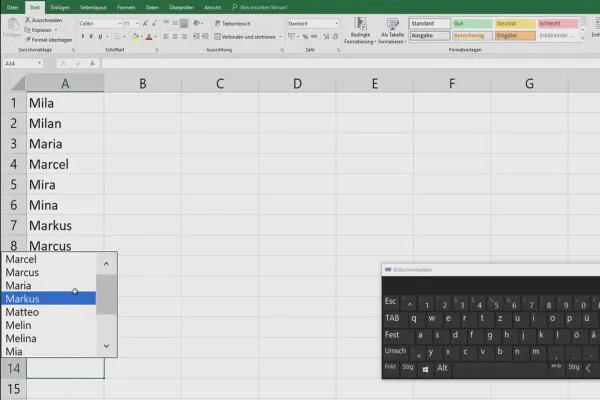
Excel tutorial: Pivot, charts and table design for clear data presentation

Excel tutorial: Pivot, charts and table design for clear data presentation
Excel tutorial: Pivot, charts and table design for clear data presentation

Excel tutorial: Pivot, charts and table design for clear data presentation
Excel tutorial: Pivot, charts and table design for clear data presentation

Excel tutorial: Pivot, charts and table design for clear data presentation
Excel tutorial: Pivot, charts and table design for clear data presentation

Excel tutorial: Pivot, charts and table design for clear data presentation
Excel tutorial: Pivot, charts and table design for clear data presentation

Excel tutorial: Pivot, charts and table design for clear data presentation

Excel course for controlling and sales: assortment list, units, currency & Co

Excel course for controlling and sales: assortment list, units, currency & Co

Excel course for controlling and sales: assortment list, units, currency & Co

Excel course for controlling and sales: assortment list, units, currency & Co

Excel course for controlling and sales: assortment list, units, currency & Co

Excel course for controlling and sales: assortment list, units, currency & Co

Excel course for controlling and sales: assortment list, units, currency & Co

Excel course for controlling and sales: assortment list, units, currency & Co

Excel course for controlling and sales: assortment list, units, currency & Co

Excel course for controlling and sales: assortment list, units, currency & Co
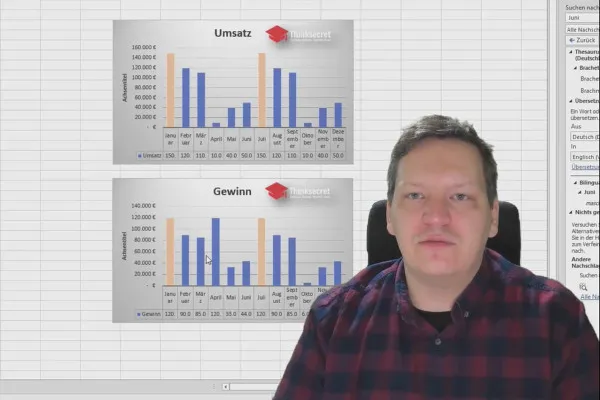
Excel training for more efficiency in the office: calendar, organization chart & Co
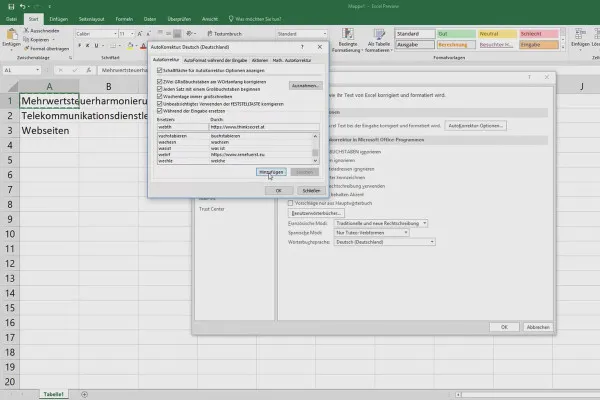
Excel training for more efficiency in the office: calendar, organization chart & Co
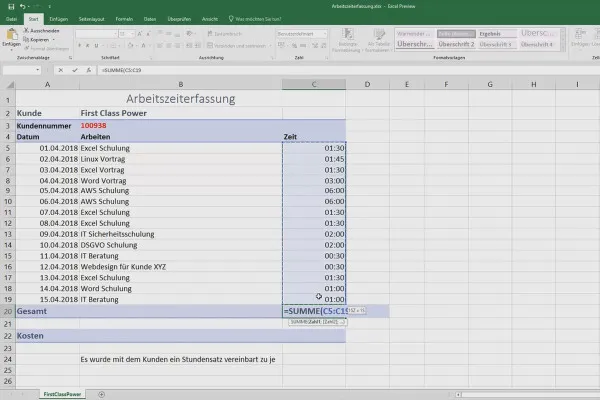
Excel training for more efficiency in the office: calendar, organization chart & Co

Excel training for more efficiency in the office: calendar, organization chart & Co

Excel training for more efficiency in the office: calendar, organization chart & Co
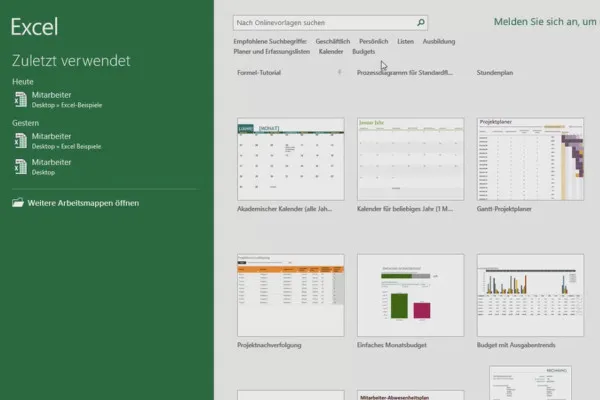
Excel training for more efficiency in the office: calendar, organization chart & Co

Excel training for more efficiency in the office: calendar, organization chart & Co
Excel training for more efficiency in the office: calendar, organization chart & Co

Excel training for more efficiency in the office: calendar, organization chart & Co

Excel training for more efficiency in the office: calendar, organization chart & Co
Excel basics - introduction for beginners

Excel basics - introduction for beginners
Excel basics - introduction for beginners

Excel basics - introduction for beginners
Excel basics - introduction for beginners

Excel basics - introduction for beginners

Excel basics - introduction for beginners
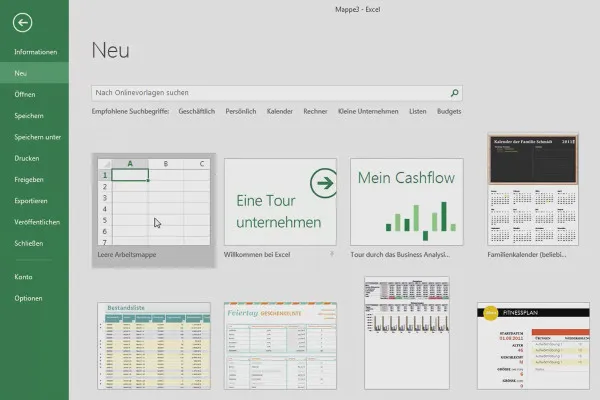
Excel basics - introduction for beginners

Excel basics - introduction for beginners
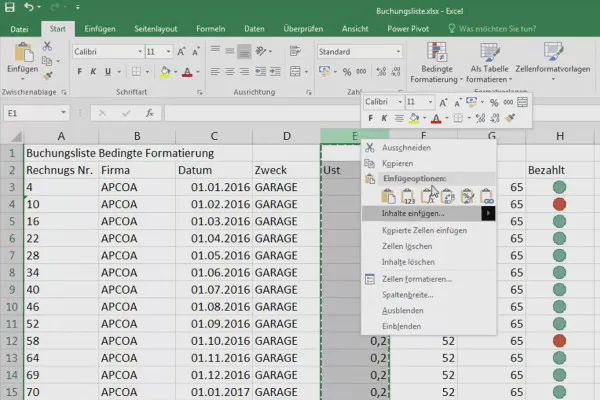
Excel basics - introduction for beginners
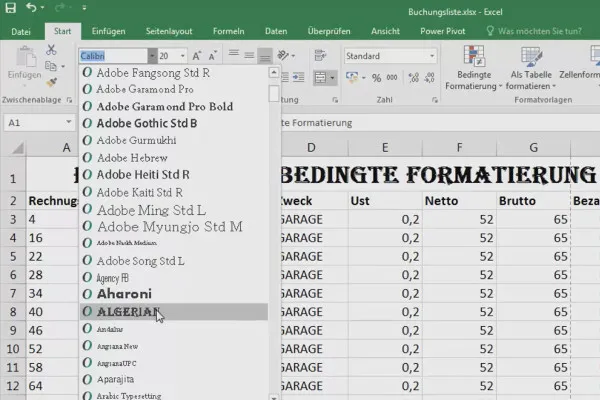
Excel basics - introduction for beginners

Excel basics - introduction for beginners

Excel basics - introduction for beginners
From cells and formulas to pivots and charts
Tutorials on spreadsheets with Excel
Basics and professional knowledge
The formula for more know-how: our Excel tutorials
Slipping in rows is a thing of the past. We help you to get a better overview of your data with Excel . Our Excel tutorials have a practical structure and guide you through the world of units and references, charts, formulas and functions, calendars and organization charts in an easy-to-understand way. Whatever your level of knowledge, the training courses offer a step-up for every level. Start with the basics and learn to juggle cells, rows and columns. Or fine-tune your existing knowledge. For more efficiency in everyday data work.
Work faster with Excel
Knowledge à la carte: our Excel reference card
One look at our reference card and you'll find the right cell or have the right formula to hand. A great asset in the daily data stream. The reference card clearly lists all the important shortcuts for Microsoft Excel and also offers 45 crucial formulas and functions for the big administrative act. Saves time and nerves. The reference card is compact and handy. You can simply download it as a PDF file and print it out - and you'll have the flood of data in order.