Data analysis
with Excel

Language: German
Data analysis with Excel for business and sales (video course)
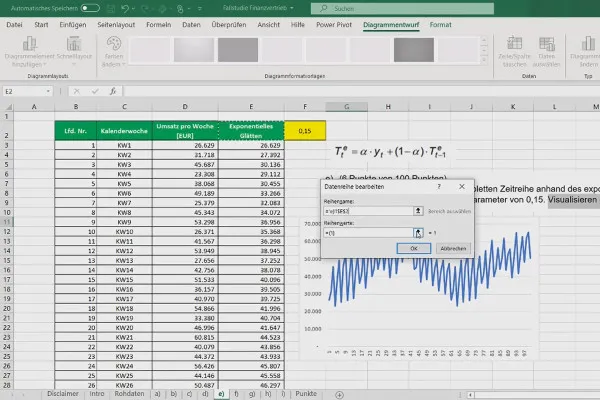
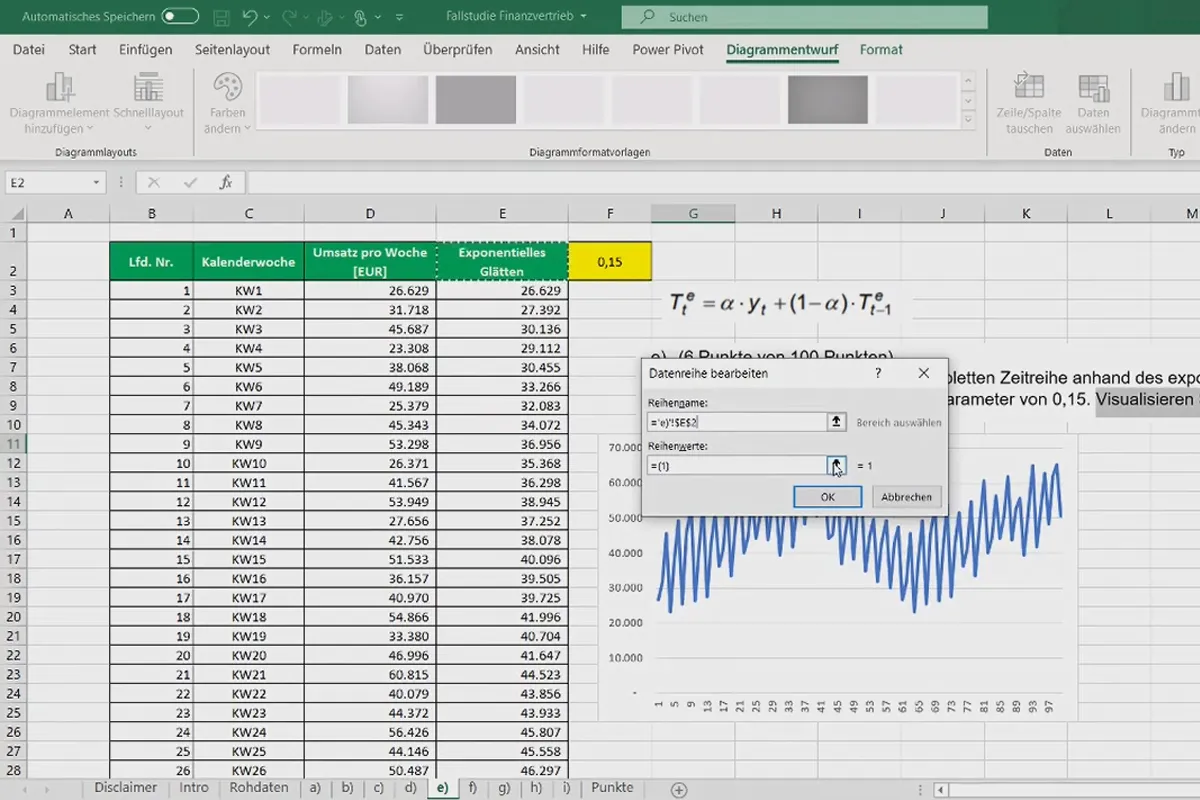
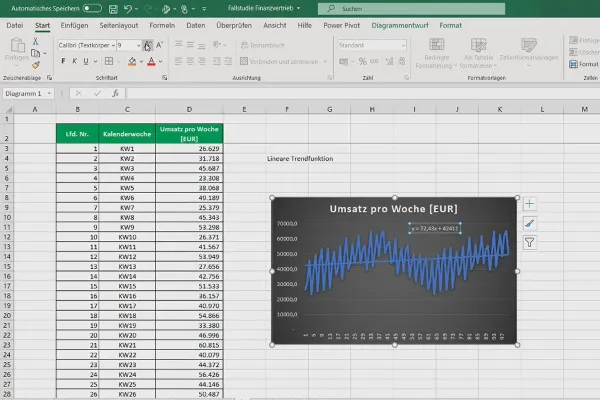
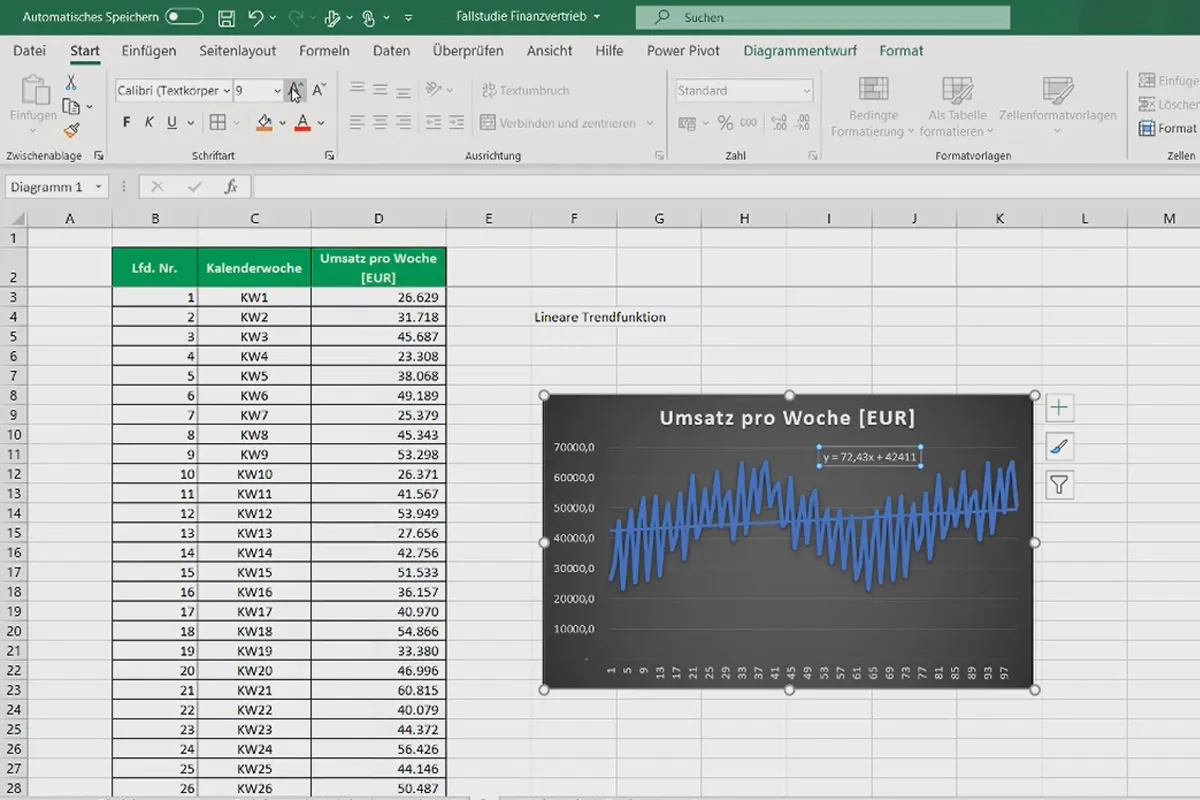
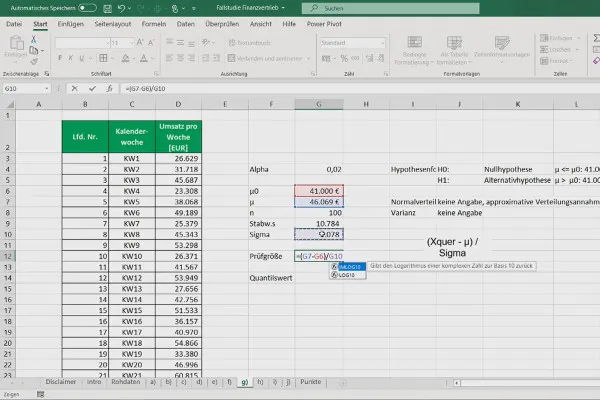
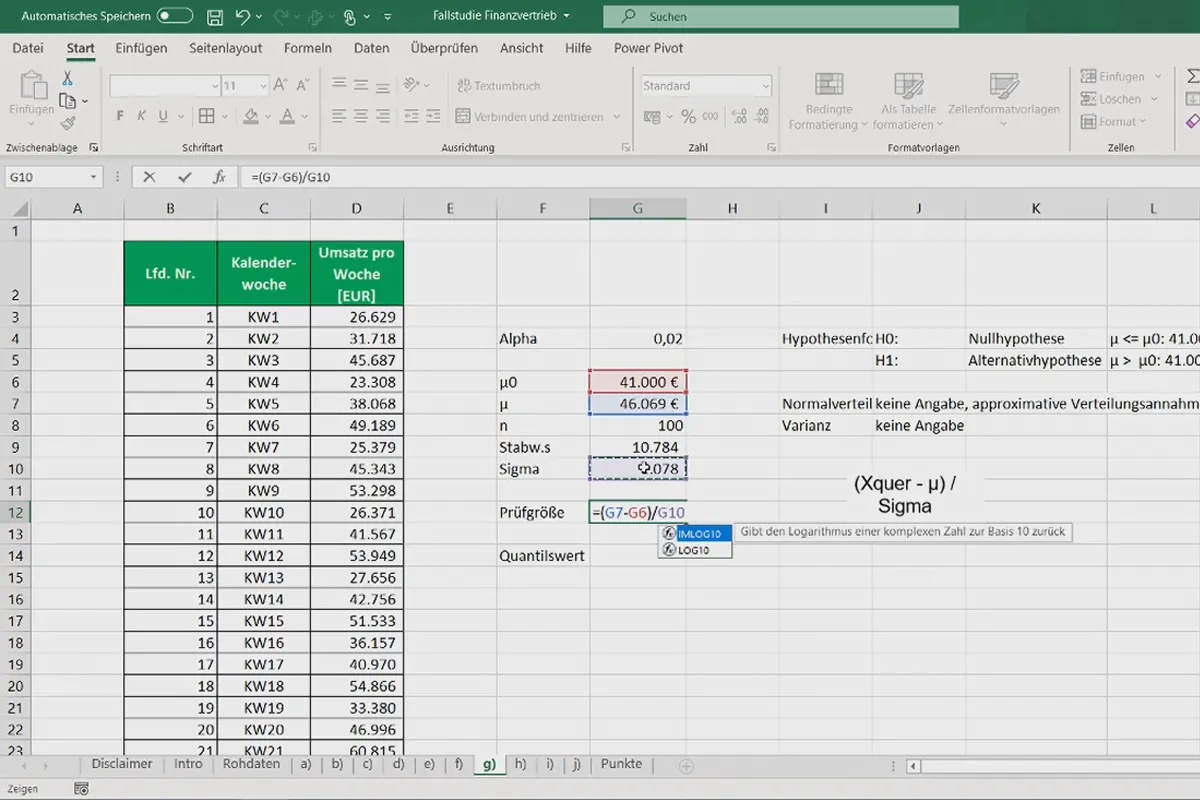
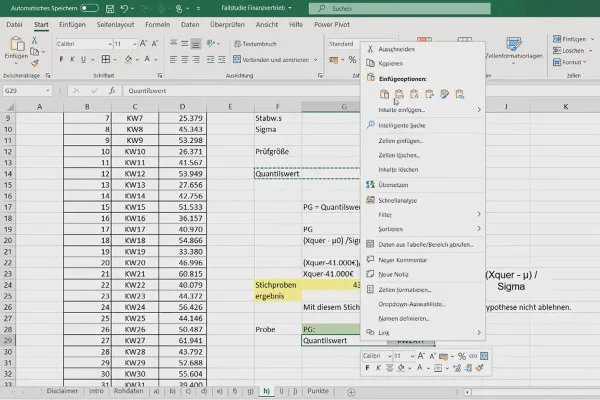
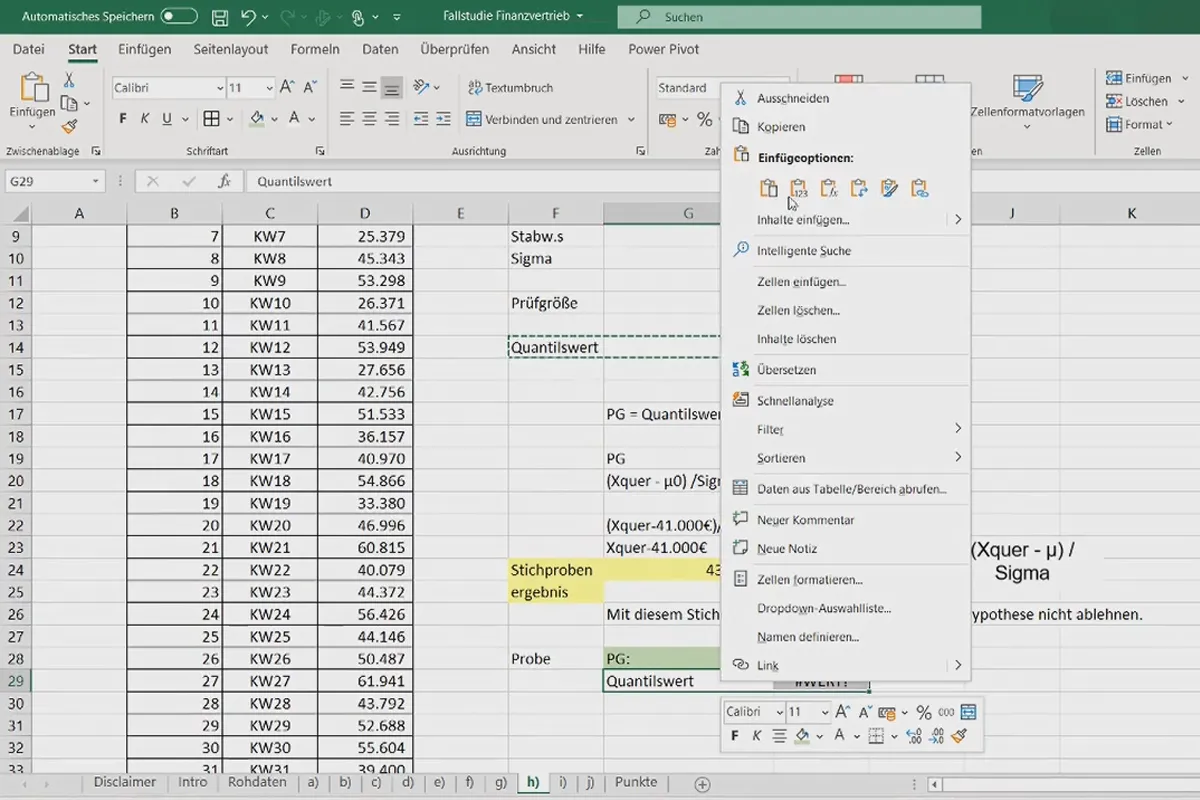
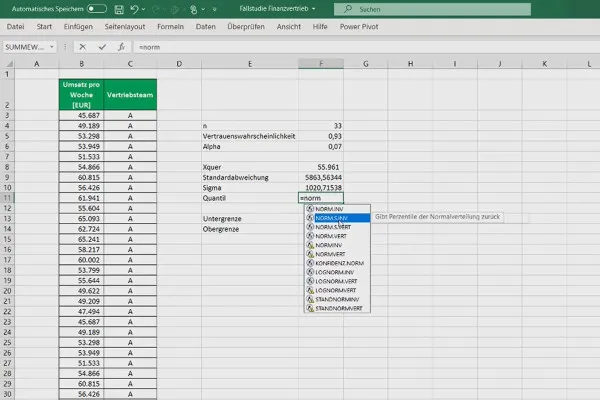
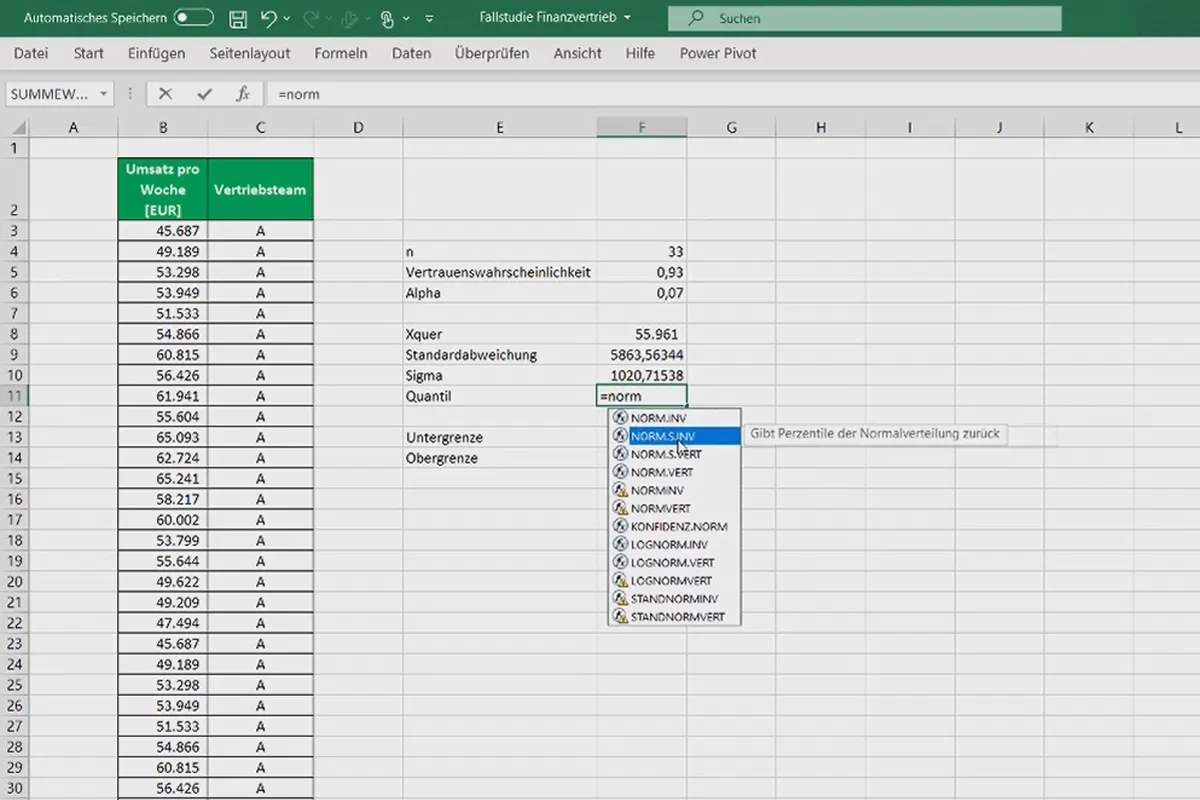
What works? Where is there room for optimization? Find answers to these questions by correctly analyzing your figures in Excel. Using a practical case study from the financial business and sales sector as an example, you will learn how to apply important methods of inductive and descriptive statistics in this course. One training course, two hours, including exercises - trainer Fabio Basler will teach you how to read your data correctly!
- Two-hour video course on data analysis with Excel using the example of financial sales
- Practical learning based on tasks, solutions and a points system
- Descriptive and inferential statistics: How to identify optimization potential in your figures
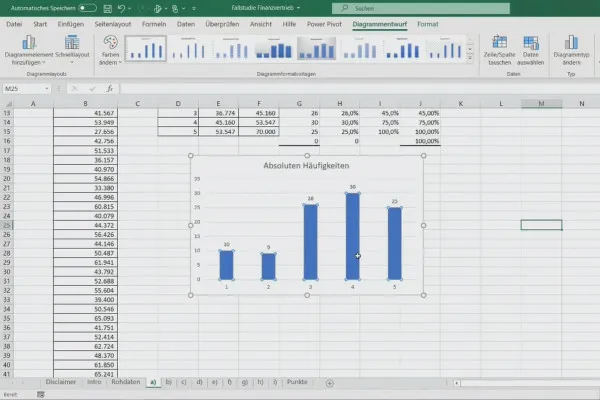
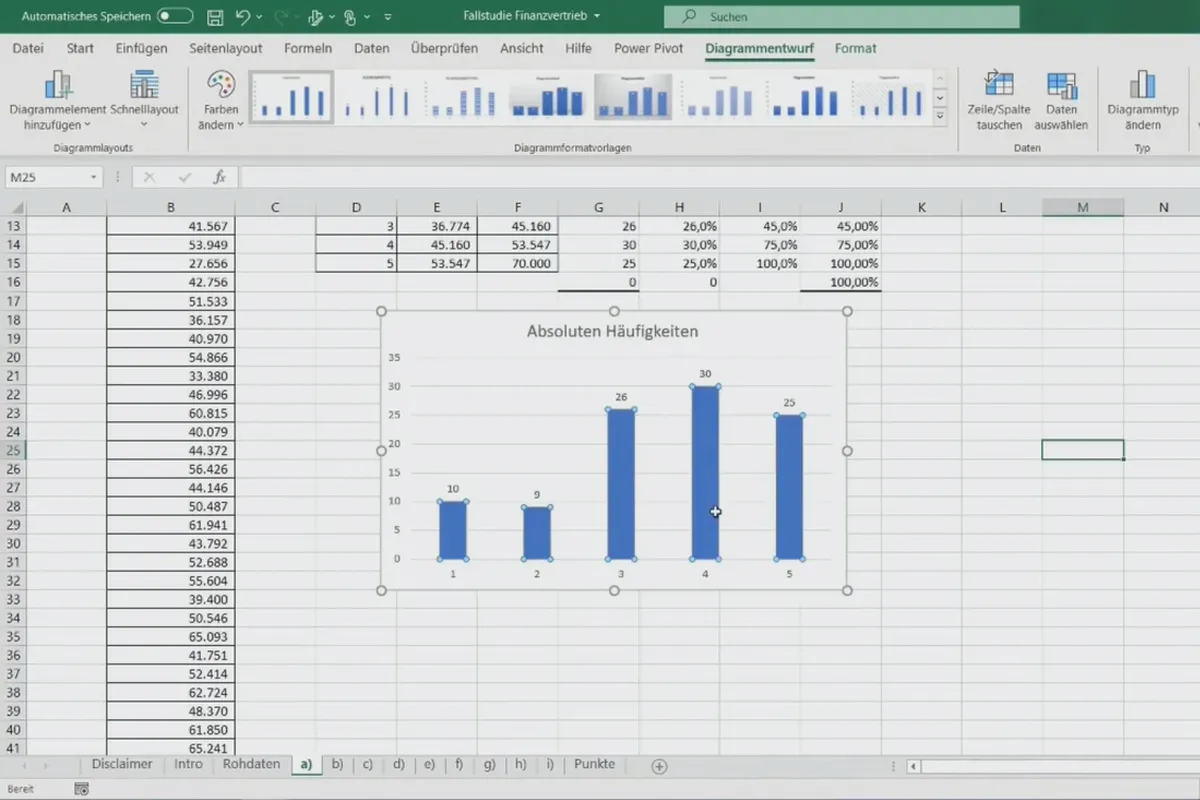
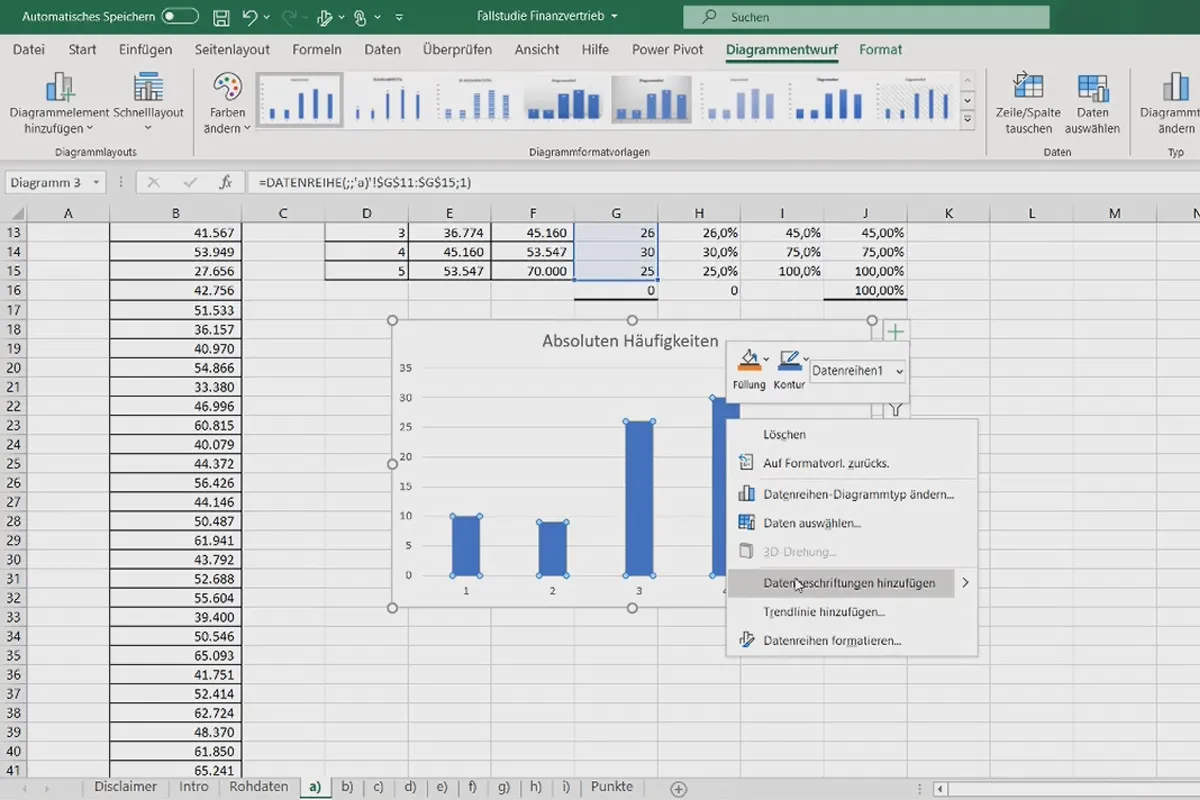
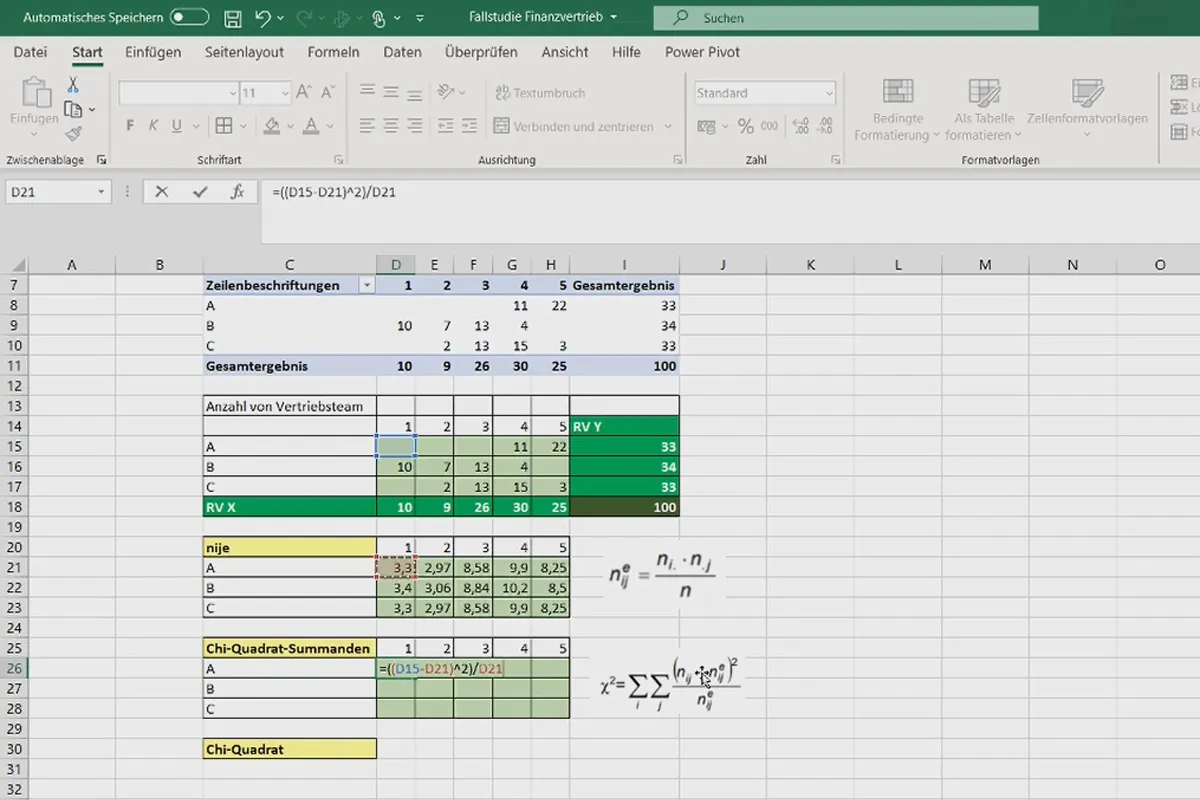
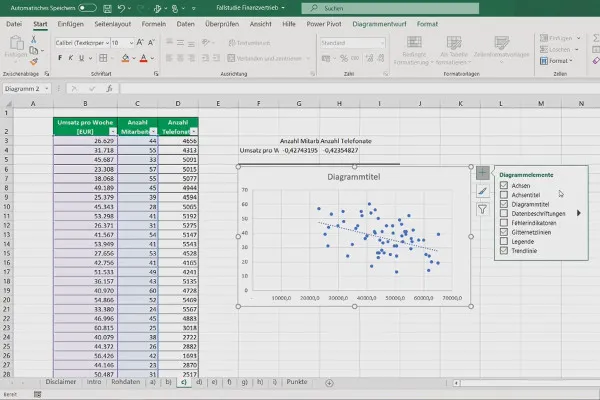
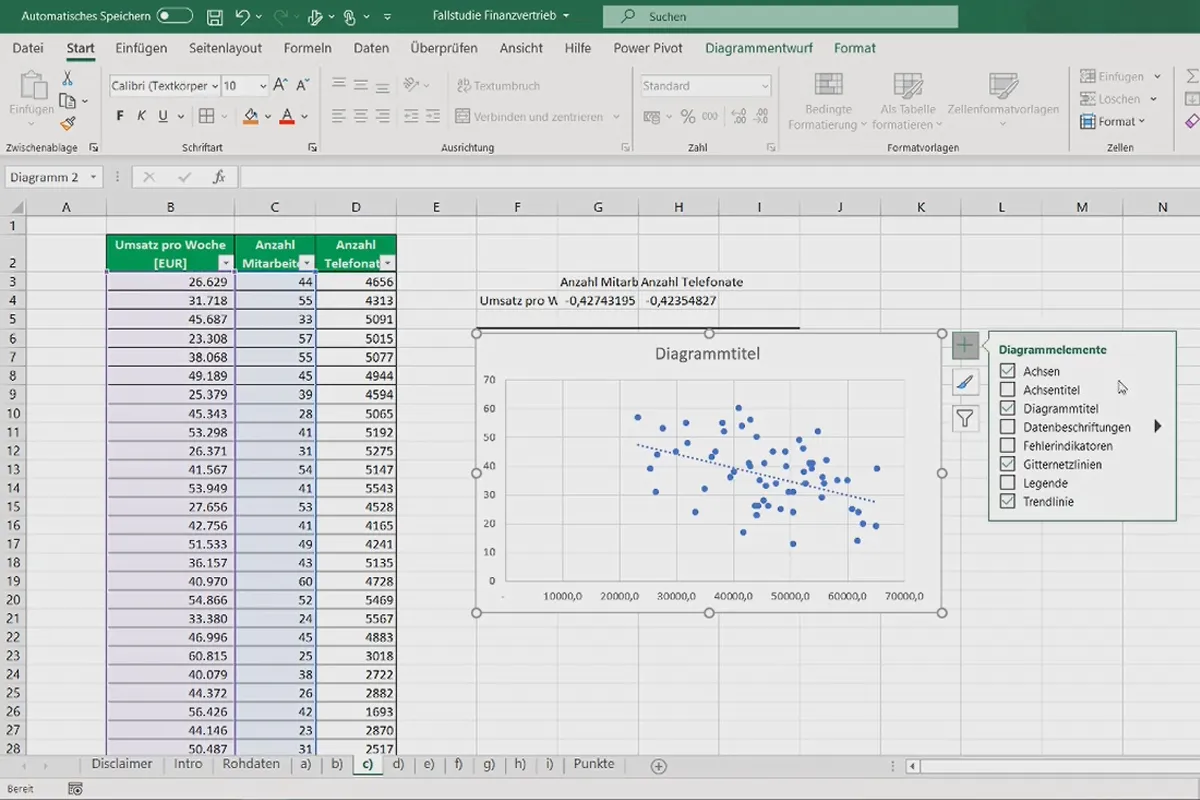
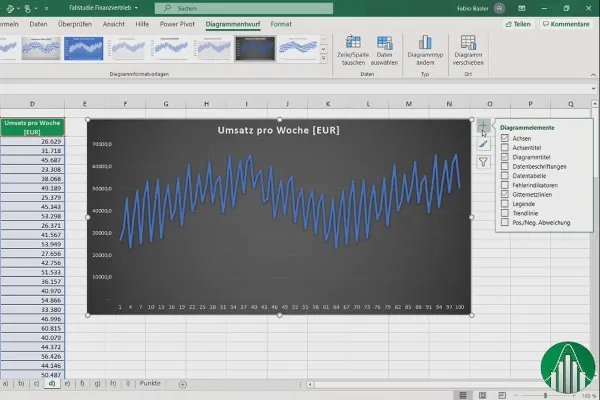
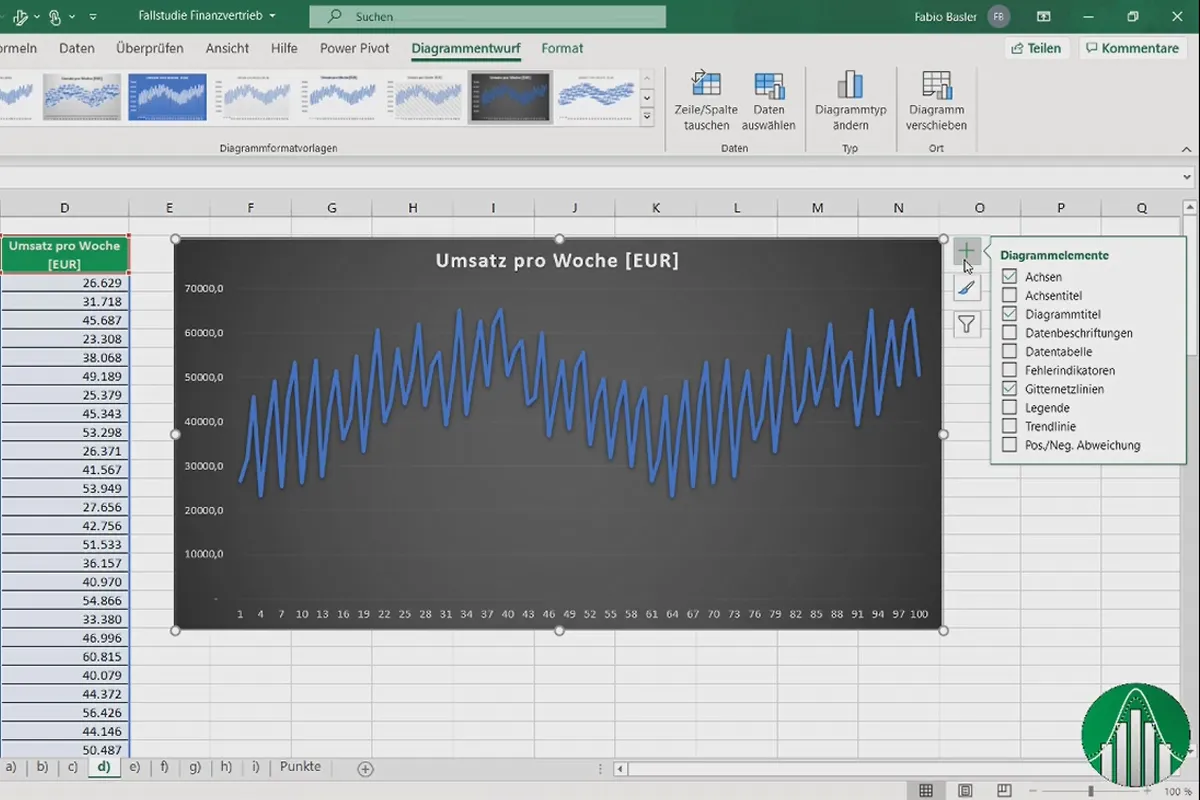
- Among other things: Frequency distribution, correlation matrix, regression analysis, 1-SP test, confidence interval
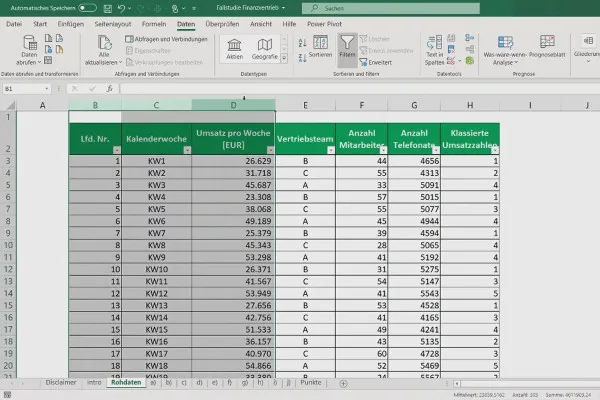
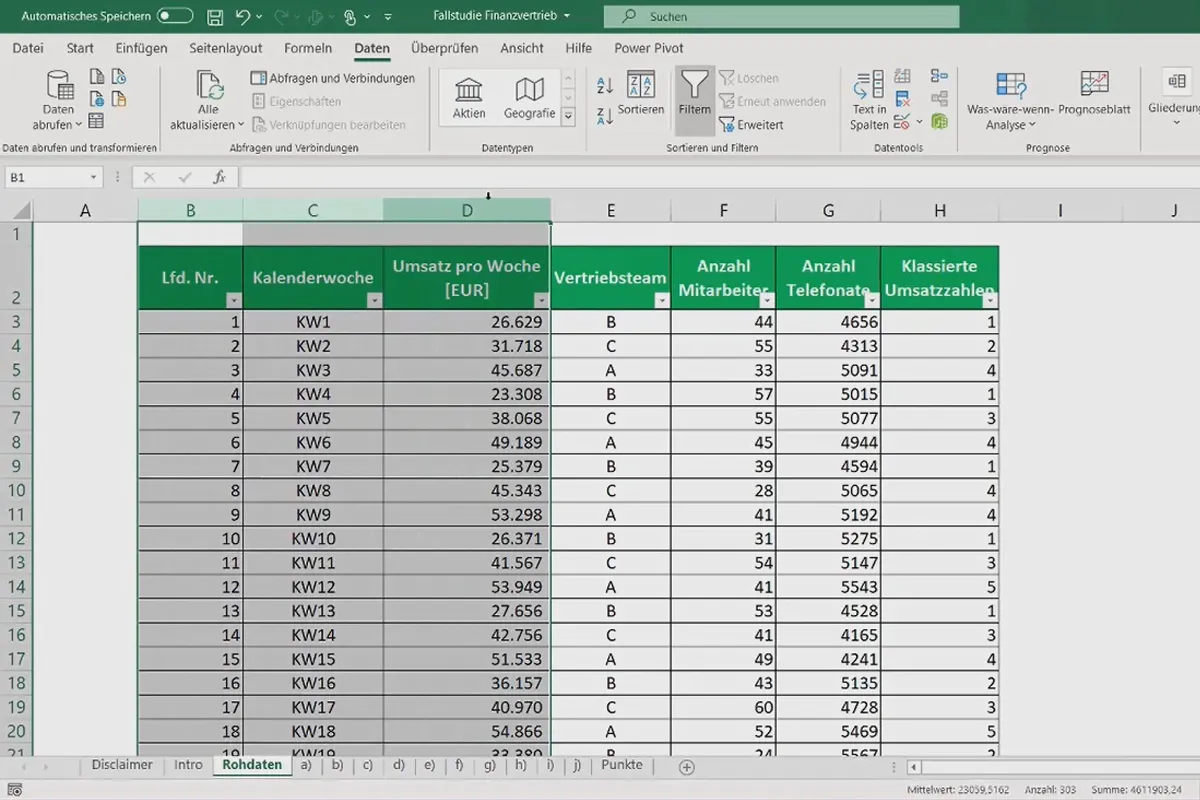
- Included: Excel raw data, collection of formulas and a summary
On the road to success! Recognize both strengths and weaknesses in your data to set up your business even better. Be smart now and start training right away!


